10 Results
View results:
Sort by:
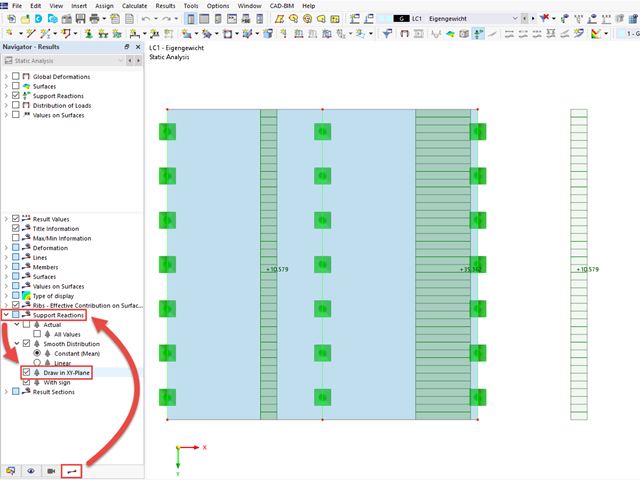
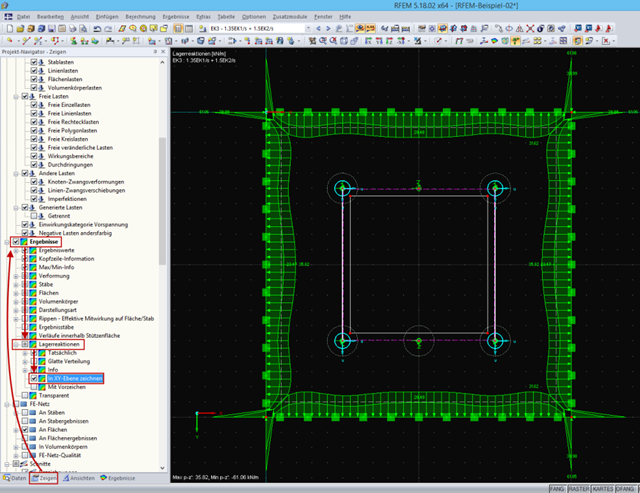
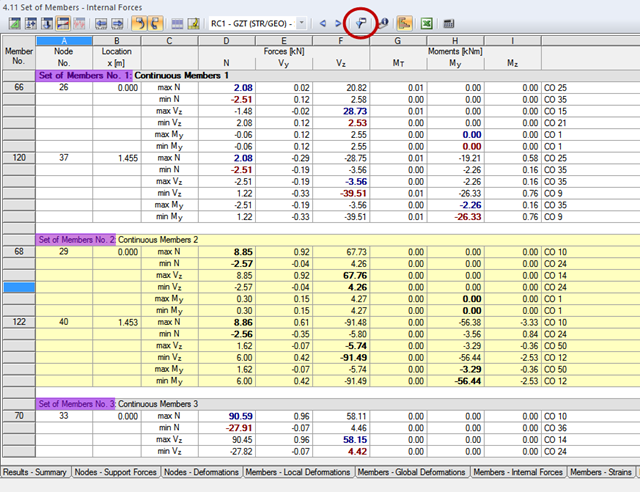
Drawing Vertical Line Support Results in XY Plane
For the result documentation, I would like to display the vertical line support results clearly in the top view. Which setting do I have to use for this?
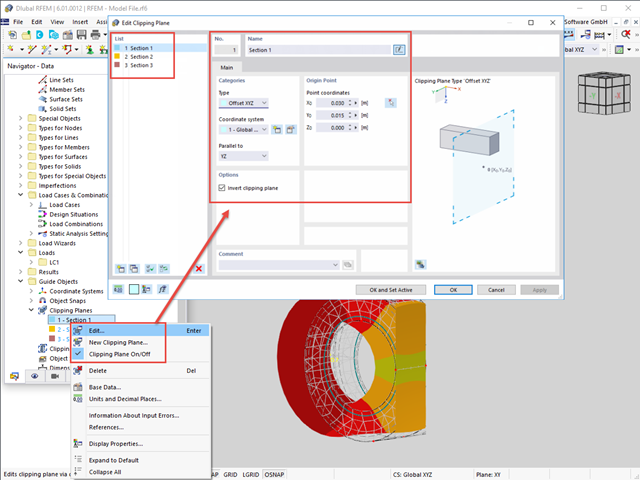
Clipping Plane
Is it possible to create different section planes for the visualization of results?
Question
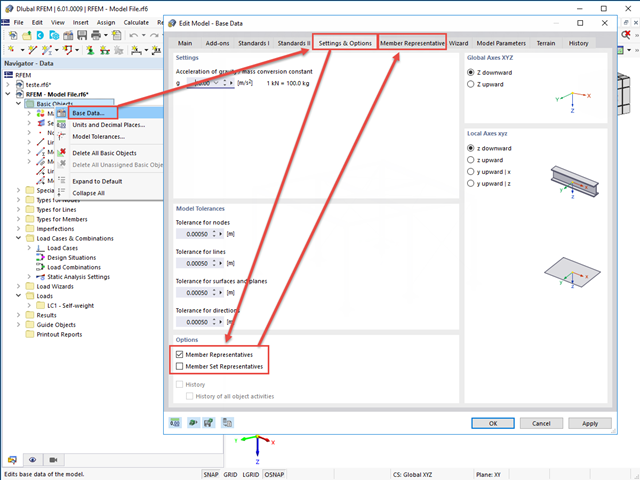
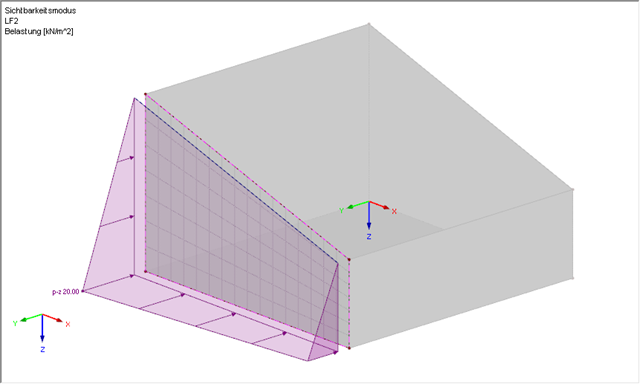
I cannot graphically display a variable polygon load on a surface correctly. It is not clear which load is actually applied. Is there any display option for this?
Question
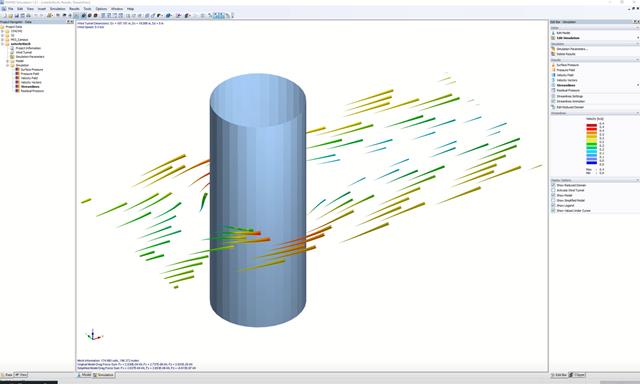
Is it possible to design a "Kármán vortex street" behind an object in the numerical wind tunnel of RWIND Simulation?
Question
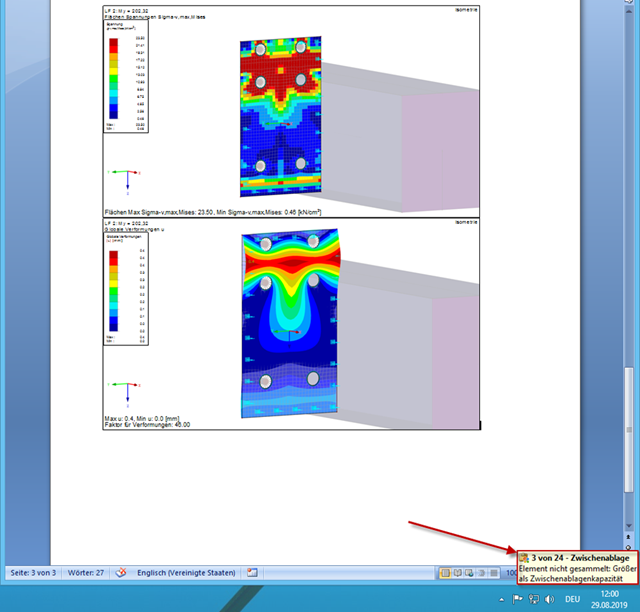
I use Microsoft Word for the documentation of my structural analysis.
For this, I use the "Print Graphic" → "Save to Clipboard" option in RFEM or RSTAB, and import the graphics into Word using Ctrl+V.
However, after I successfully inserted some images, nothing more is happening.
What is the reason for this, and how can I avoid it?